
I briefly logged into Twitter’s free analytics service again today, prompted by a conversation on (you guessed it) Twitter about the demographics of an account’s followers and the news that it was now open to all.
Absolutely thrilled to open up access to http://t.co/wcU6oj9hFM to EVERYONE. Check it out, and let us know what you think!
— Ian Chan (@chanian) August 27, 2014
Today, any Twitter user can log in and access the online dashboard and see what Twitter says about how people are interacting with your tweets, among other insights.
I was glad to see that dashboard is definitely working better now than when Twitter first gave me partial access. (I could see follower demographics but not impressions). I know that some people may see these stats as fake-ish numbers, but I wish Tumblr, Pinterest, Vine, Instagram & Google+ offered similar free dashboards for their users — certainly, it would be great if Facebook did for people who turned on the Follow feature.
What did I learn?
 First, looking at the highest impression number (155,000 impressions on this tweet) I was reminded that the concept of “free speech zones” remains controversial in the United States, and that tweeting about them can result in a different kind “engagements” than RTs or Favorites: angry @replies from lots of strangers.
This is particularly true if combined with a journalist embroiled in controversy over a misidentification of ammunition and the #Ferguson hashtag.
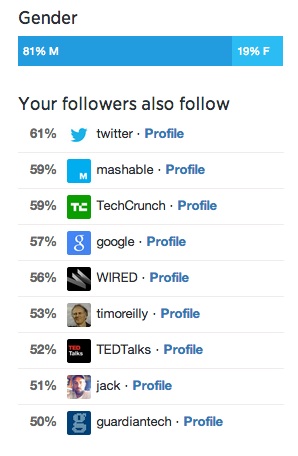
Second, the gender numbers in the demographics of my followers continues to be heavily skewed toward men (81% vs 19%), a situation that has endured more or less ever since the beginning of 2010, when Twitter began recommending me to new users in its technology vertical.
I invite and welcome any and all women who like to follow me to do so here, if you’re interested in the sorts of things I tweet about, just as I do on Facebook or other social networks.
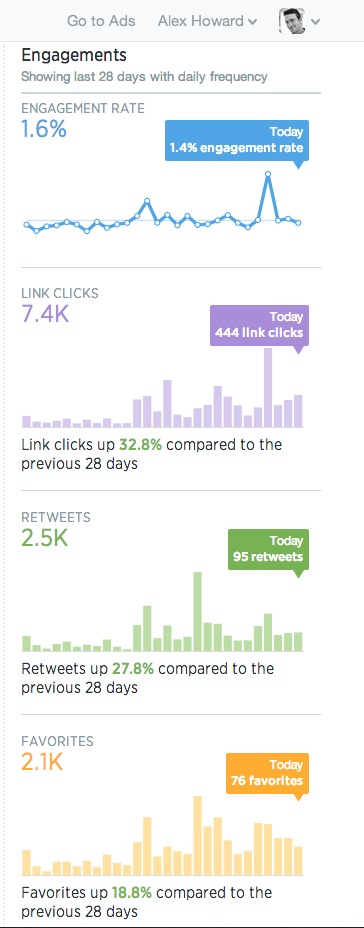 Finally, what Twitter Media and News staff had already told people who are listening is backed up by what they’re showing me: including pictures, maps and graphics in your tweets will raises your “engagement” numbers, at least as measured by people resharing tweets, favoriting them, @mentioning or @replying to them.
I’ve intentionally done that more over the latter half of August, and it shows up in the data.
It takes longer to find the right image for a tweet but the effort can pay off.
Adding that to the process reminds me of how I described Twitter back in 2008: a distributed microblogging platform.
While a few tweets may still be produced and received as simple, humble text messages, as in 2006, many more are much more complicated, and have been for some time.
Back in 2010, the map of a tweet already looked like this under the hood, with some 30 lines of meta data.
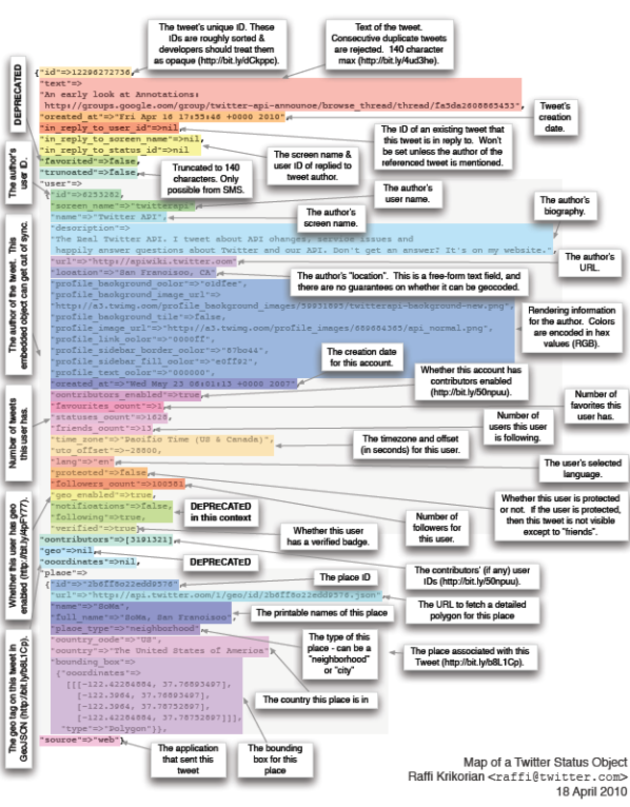
Years later, updates to the platform are much more complex, with integrated cards, videos and pictures. As Twitter rolls out e-commerce from within tweets, I wonder if better dashboards for sales, subscriptions and other conversions might be on the way for the social media company’s customers, if not, perhaps, all of its users.


Pingback: Is Anyone Actually Reading Your Tweets? Now You Can Find Out. | TNT Research
Pingback: 4 Ways Twitter’s New Analytics Dashboard Can Help Businesses | SF Gazette